
Bitcoin Weekly analysis - week 1, 2021
Bitcoin Weekly analysis - week 1, 2021

We come from an absolutely bullish past week for Bitcoin, which had opened the week with a price of $46020 and had pushed up to make a weekly high of $48881 on September 18, to settle at a week-end price of $47231.
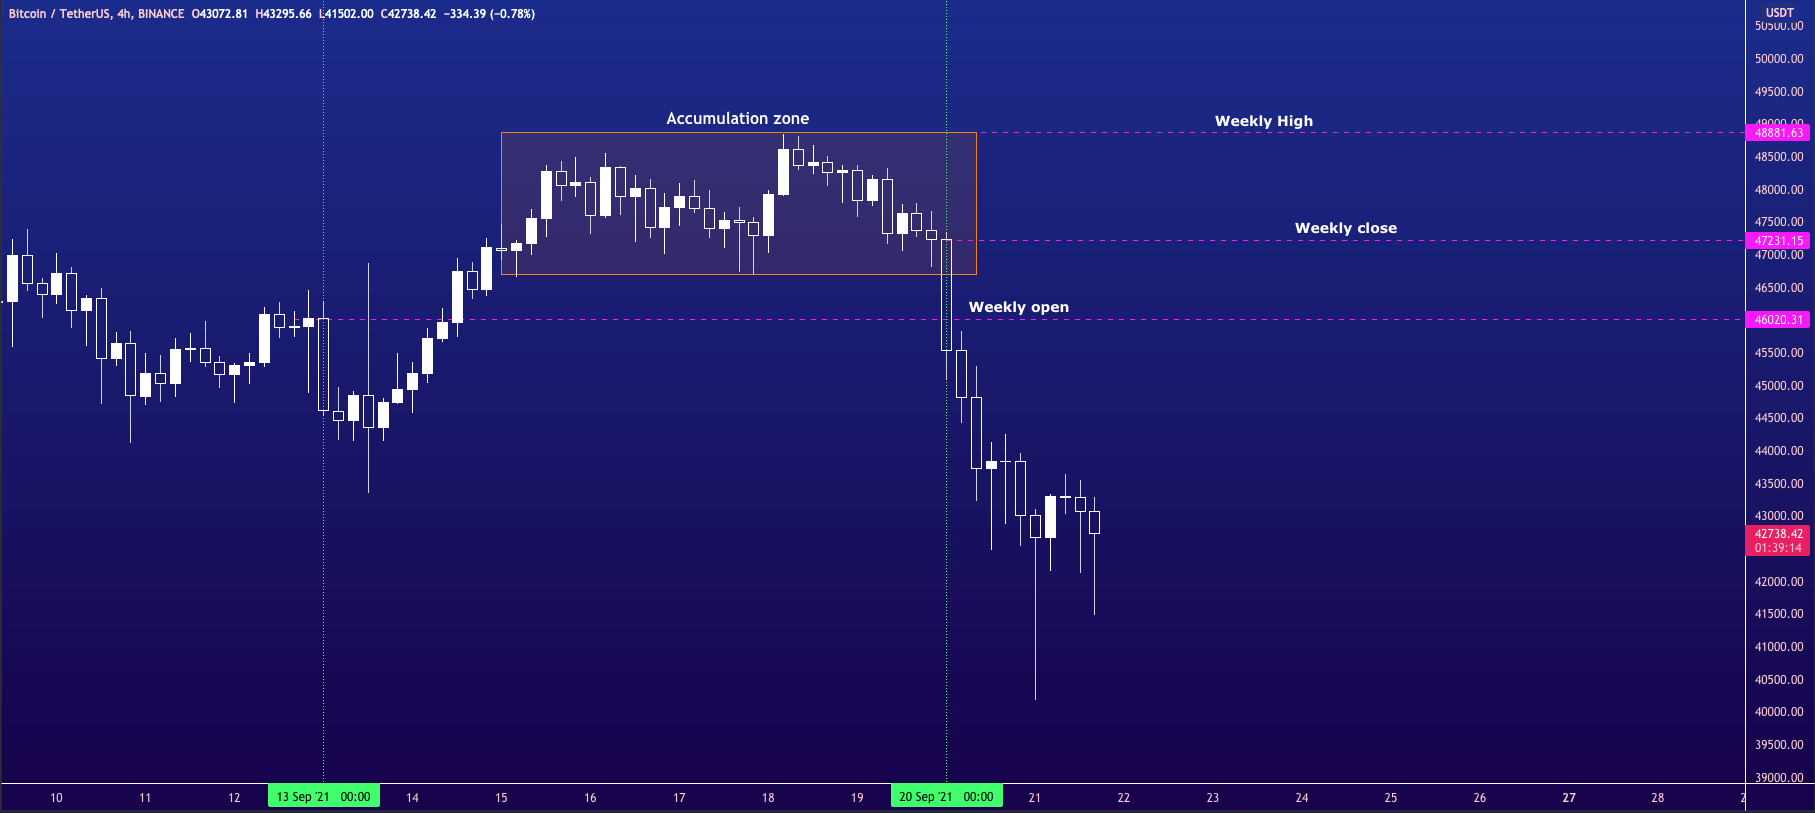
Since September 15 the price of Bitcoin had shown signs of fatigue, in fact it has created an accumulation zone with a bottom of the range that went from 46696 up to a top of the range of 48877, this indicated that surely there would be a strong movement because when prices lateralize it is a symptom that we are in an accumulation phase and these phases of accumulation are always followed by very strong breaking movements, and so it was, Bitcoin has broken down the bottom of the accumulation range in the area of 46696$ with a strong movement, accompanied by fairly high volumes compared to previous days.
Bitcoin on-chain analysis
The Bitcoin exchange flow reserve indicates the total amount of coins (in this case bitcoin) held on Exchange addresses, and thus measures the potential for selling in the market.
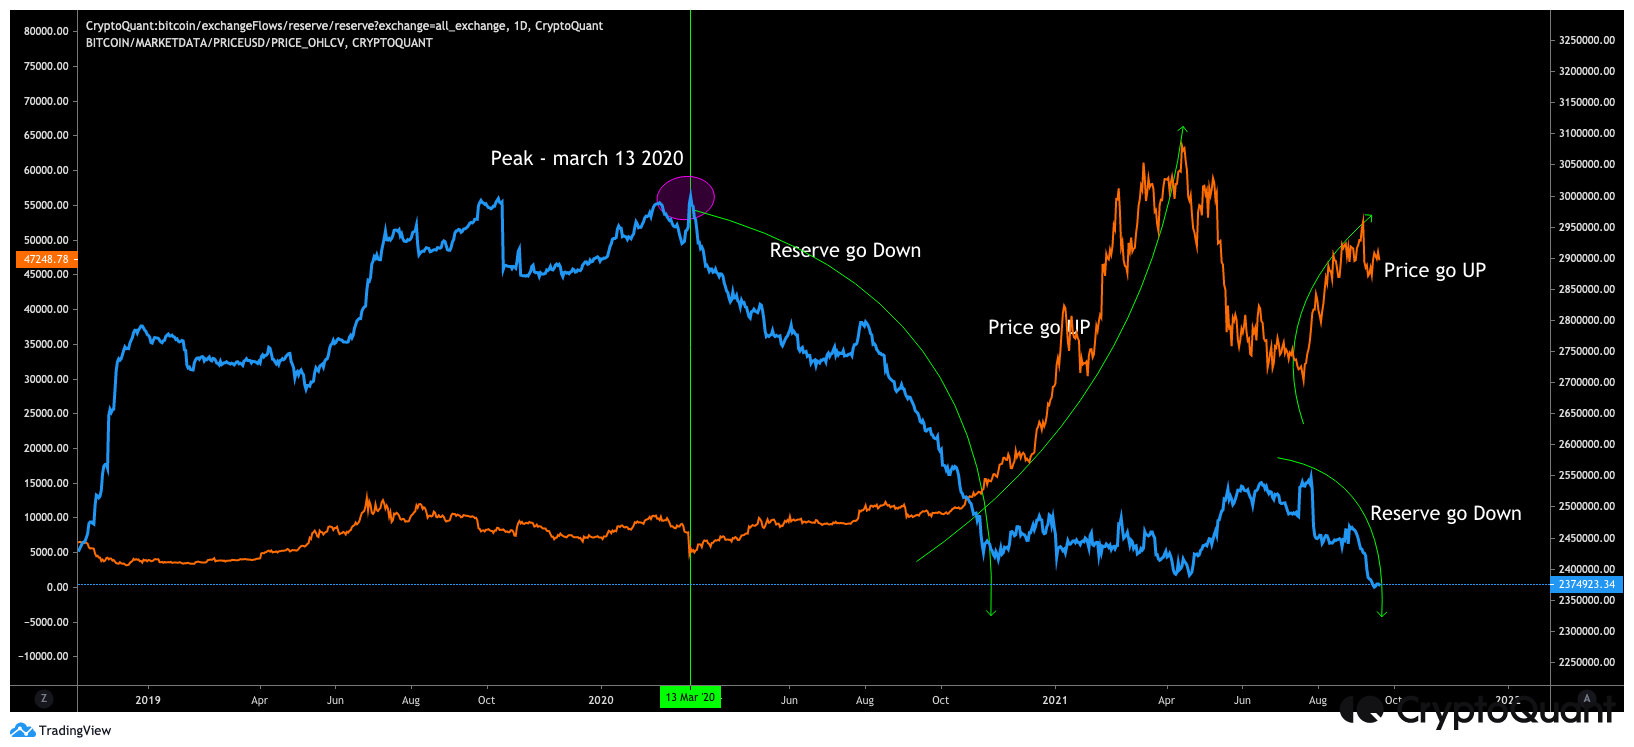
As we can see from the chart, we have a peak of reserves on March 13, 2020, from that moment until April 20, 2021 the reserves within the exchanges continued to fall, that is holders preferred to keep their Bitcoins within their private wallets instead of keeping them within the exchanges(absolutely bullish signal, in fact it coincides exactly with the increase of the price of Bitcoin up to almost 64k$, moment in which the inflow of bitcoins within the various exchanges began to increase again (Bearish signal) until July 26th 2021, moment in which the reserves of Bitcoin within the exchanges began to leave the exchanges again (bullish signal), until today.
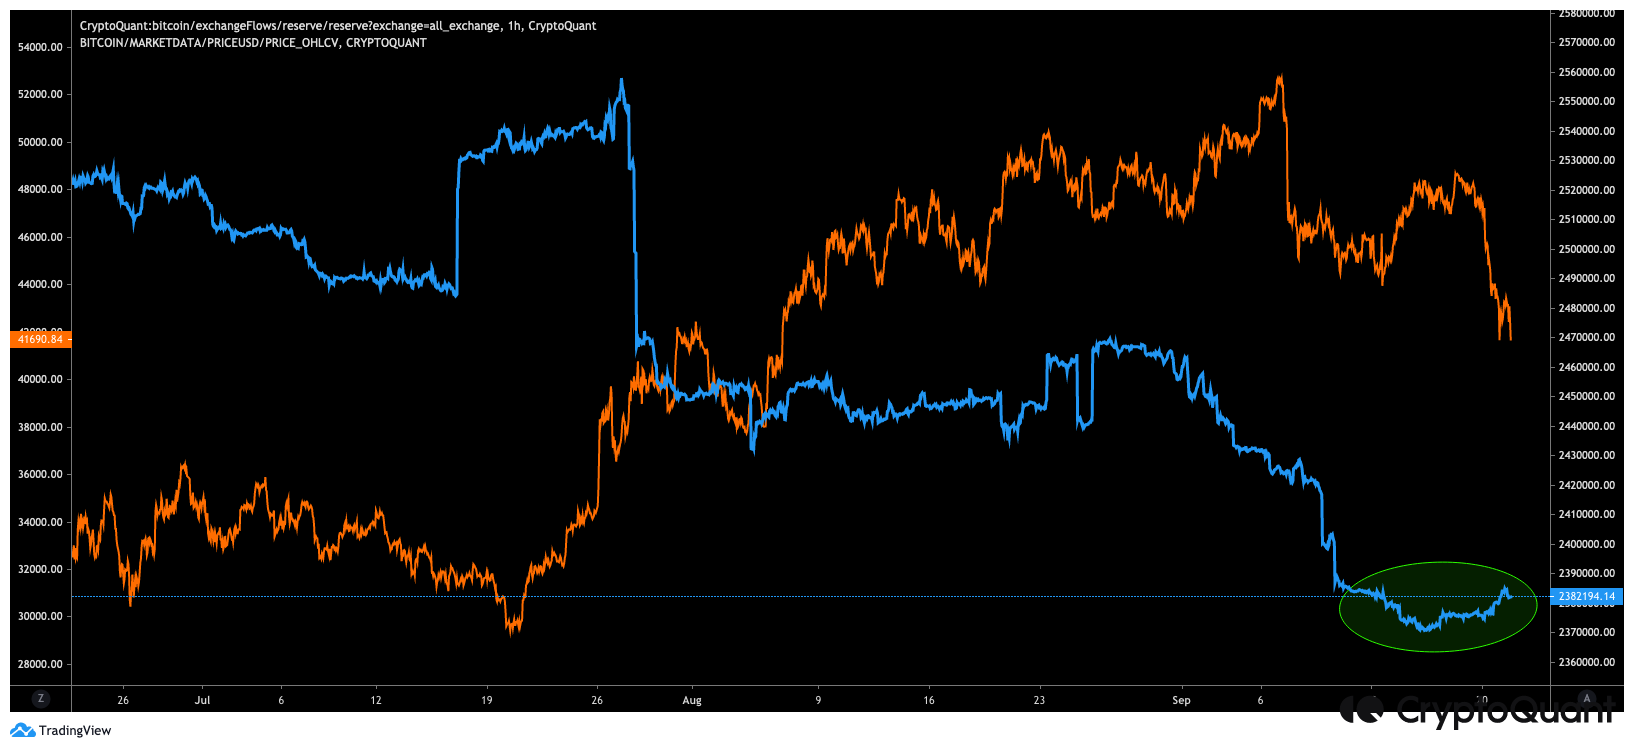
Right now we are in a key area because the reserves have lateralized, and we are trying to break the previous area of reserves to the upside (Bearish) or continue with the trend of reserves to the downside (Bullish), so if the reserves of bitcoin within the exchange continue to fall it would be a very good signal of continued upward prices, but if there would be a substantial rebound and flows to the exchange begin to rise again it would be a Bearish signal.
For now, however, there is still no reason to worry too much because despite the recent collapse of bitcoin does not seem to have increased much the flow of bitcoin to the exchanges but instead seems to have remained fairly stable.
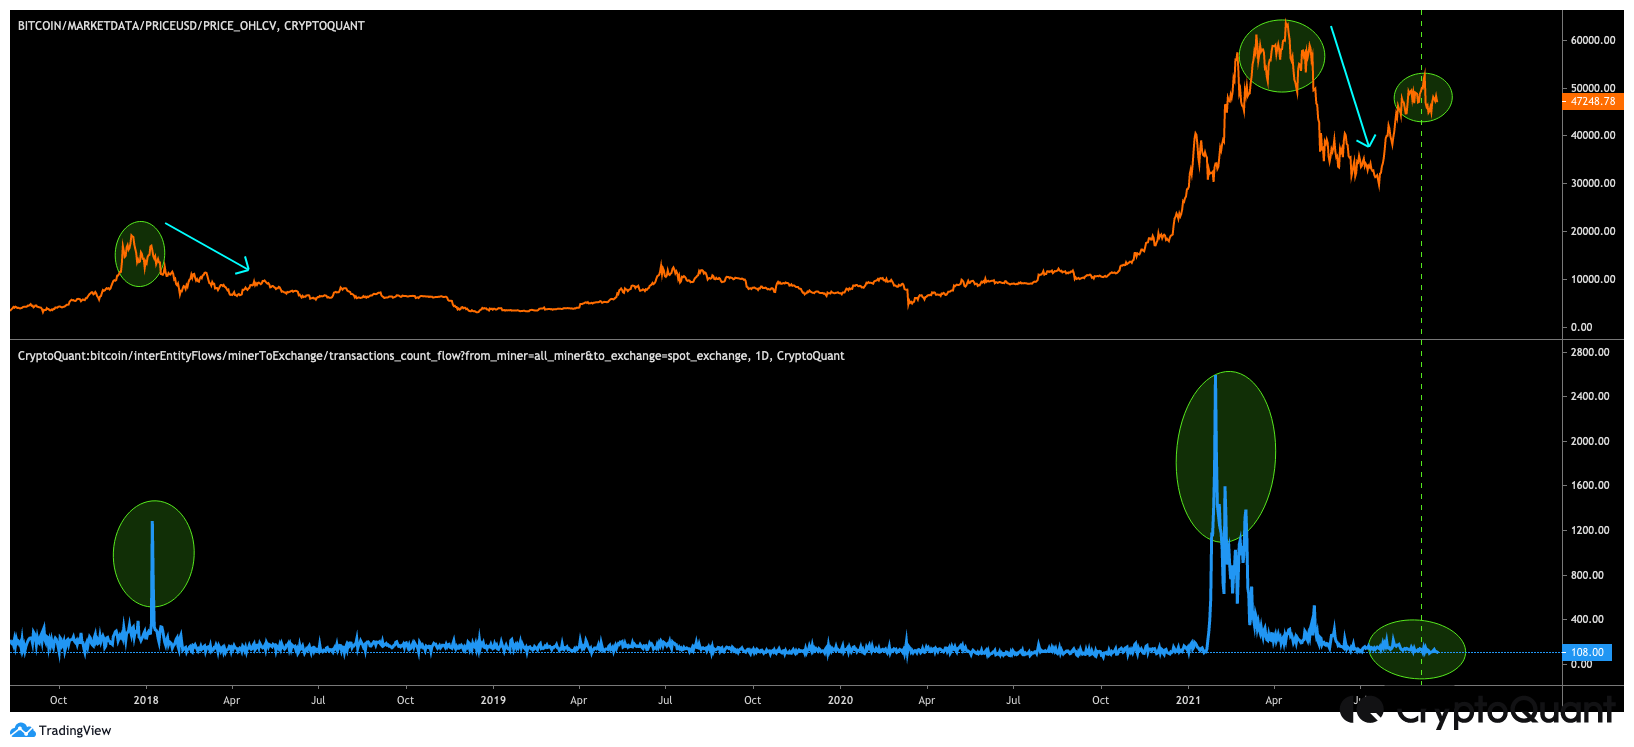
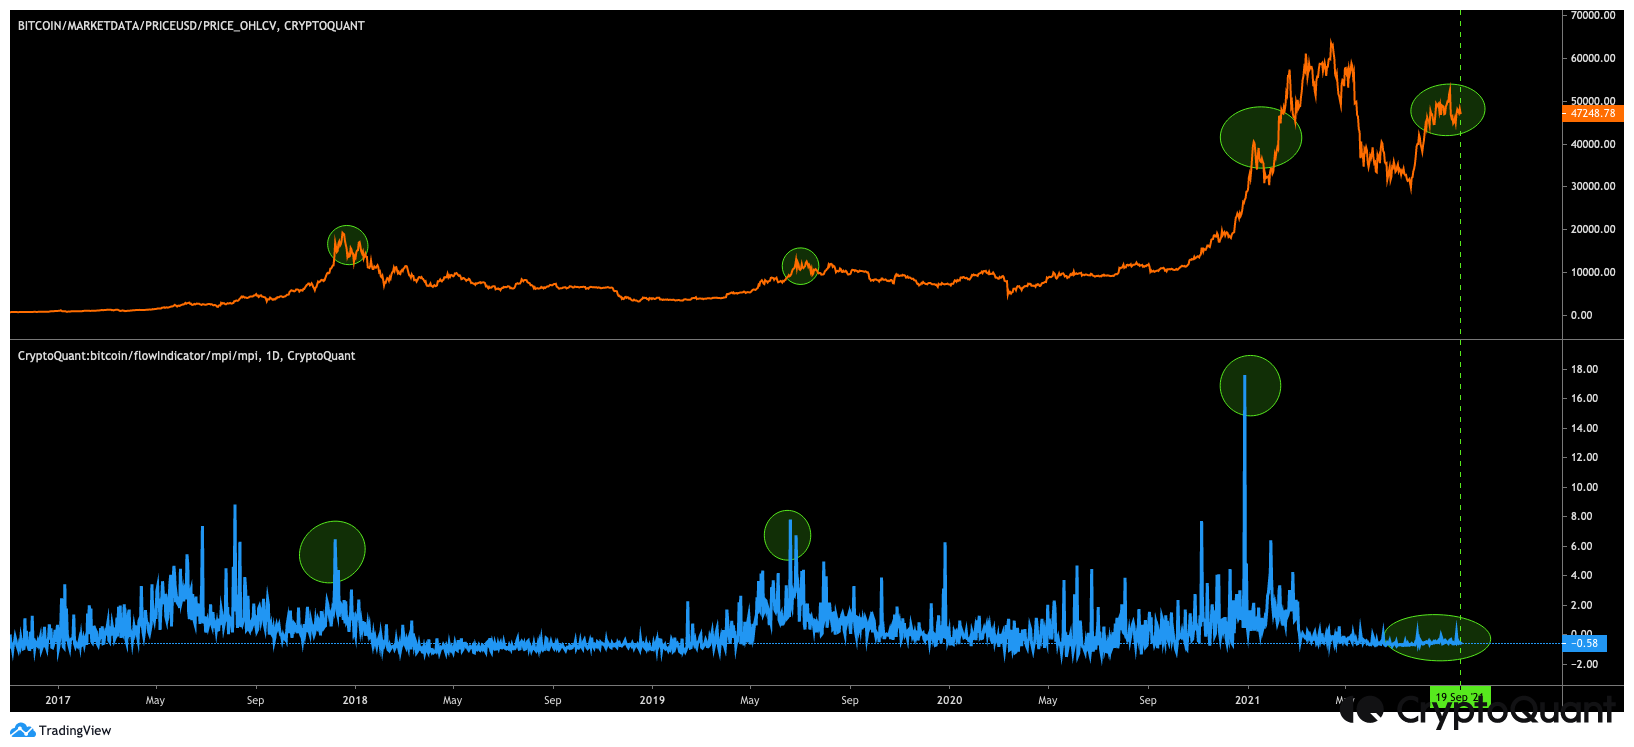
Miners to Exchange Flows: This indicator helps to see how frequently all miners are transferring bitcoin to all exchanges, if bitcoins are being sent to exchanges more frequently, the price will likely be bearish as they are selling bitcoin on the exchange and not through the OTC market.
From the chart we can see that in January 2018 and 2021 there was an increase in the flow of bitcoin from miners to exchanges, a symptom of a continued bearish trend. In this case the flow is absolutely normal with no particular anomalies, so for now there is still no Bearish signal from the miners.
The MPI is also at an absolutely low value, which is at least a sign that the market at macro level is still stable for the time being:
Bitcoin Options Analysis
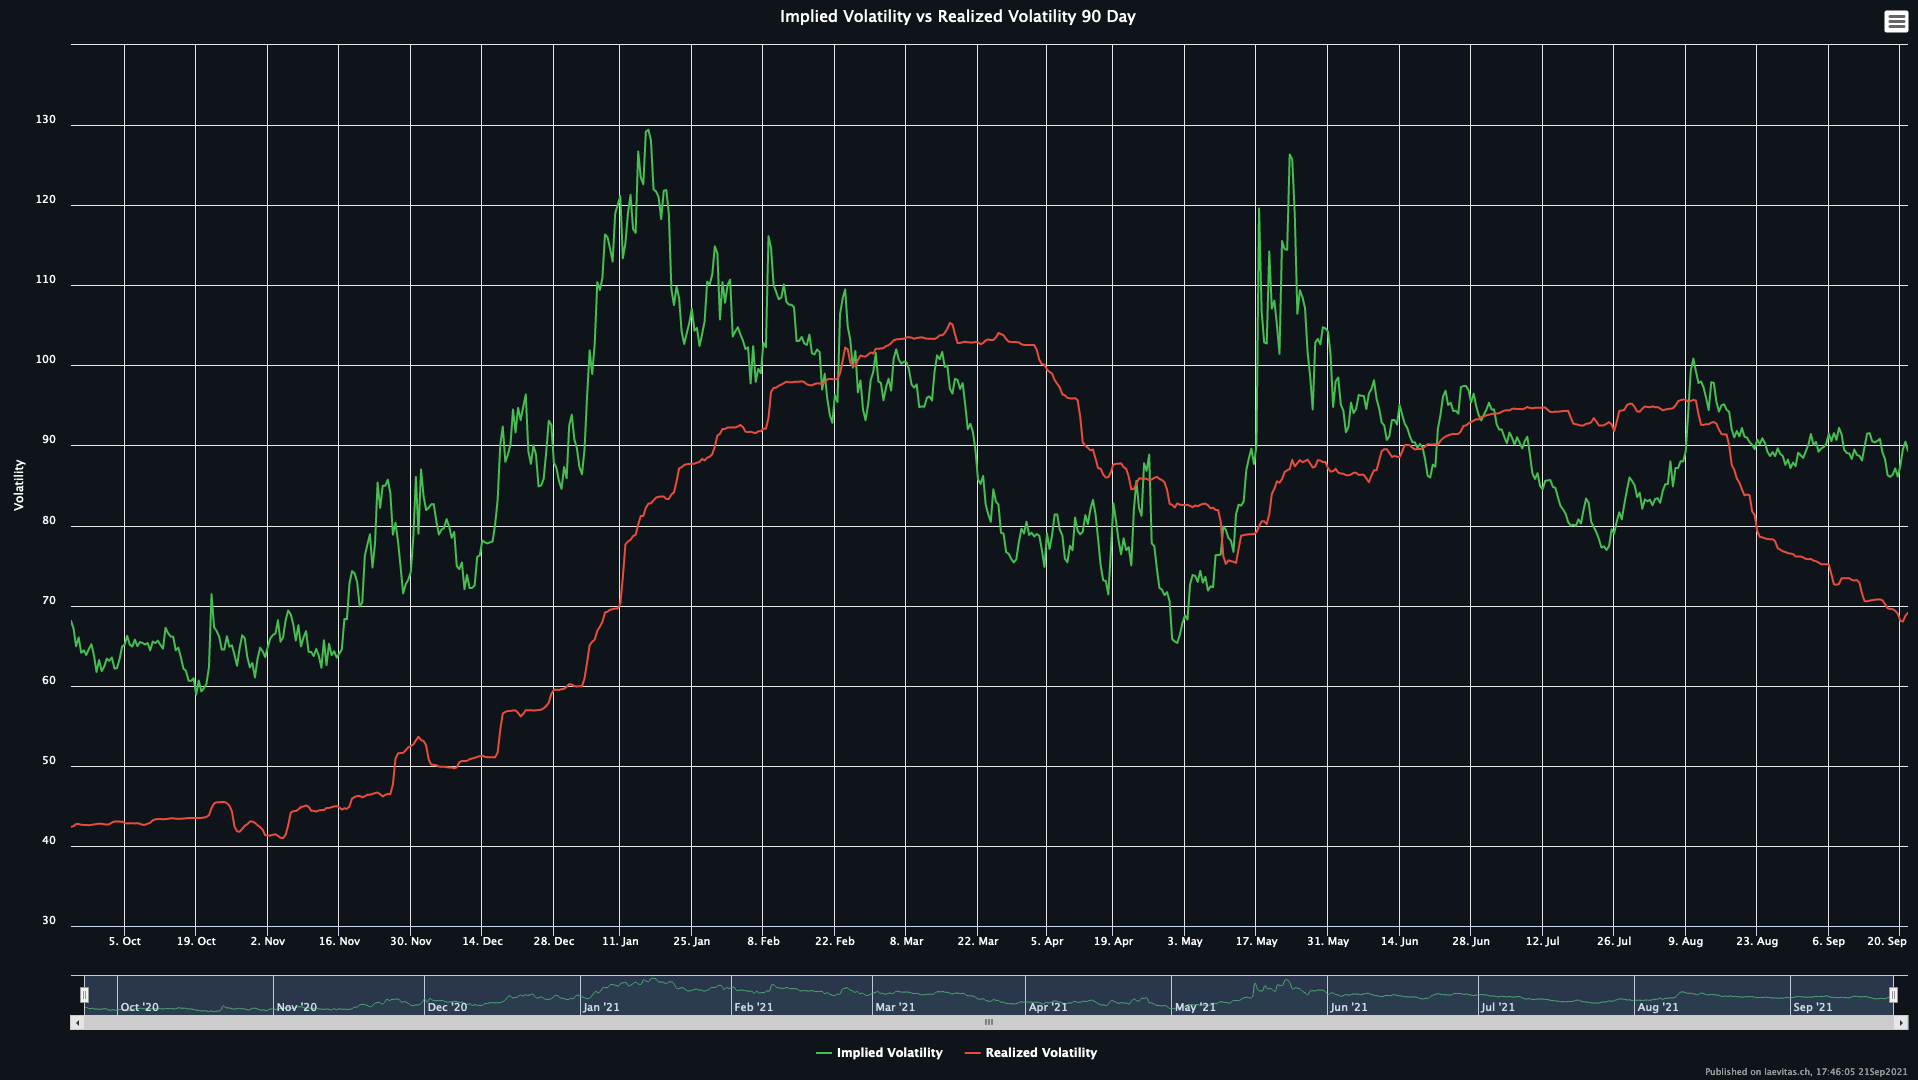
In this moment the implied volatility is still above the realized volatility, this could indicate that there is still room for another strong movement.
Remember also that in case the Realized and Implied Volatility continue to fall it could slow down the bullish momentum and the market could settle for some time lateralizing the price, or in the worst case make Bitcoin's value go down in the absence of a strong sentiment from traders to bring back up Bitcoin.
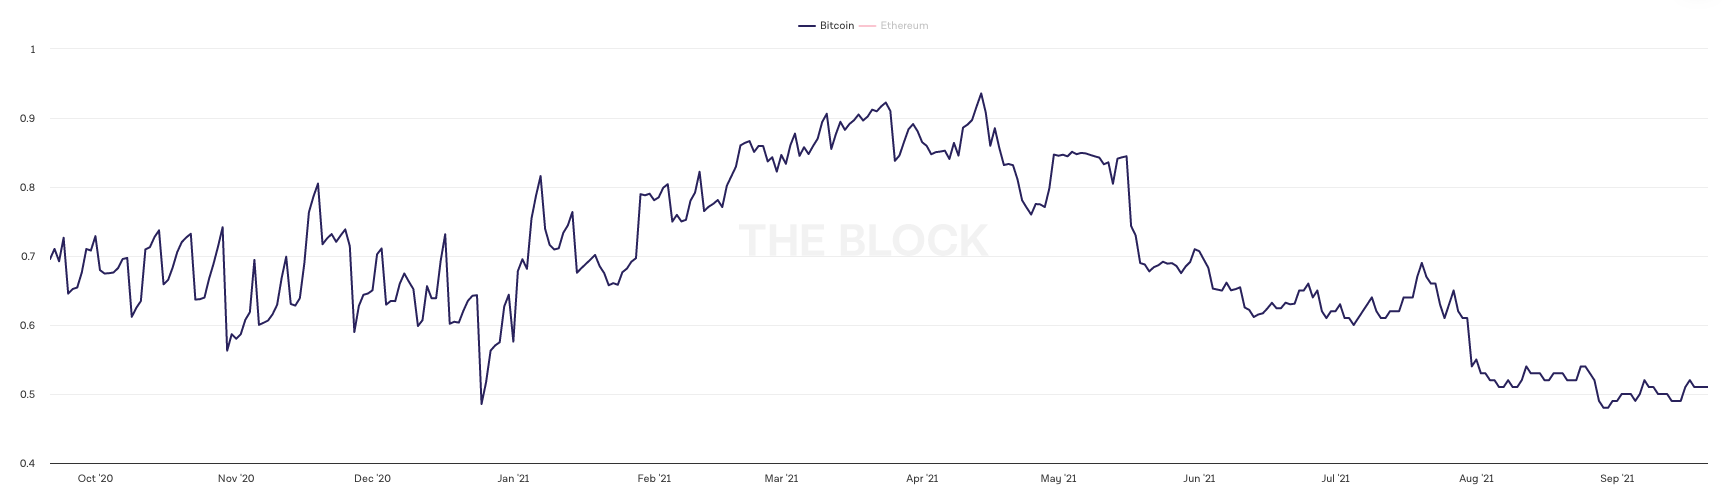
The Put-Call Ratio remains in the 0.5 area, a sign that the market has not yet changed trend, remaining (for now) Bullish.
This week there are over 63k options contracts expiring on Friday, September 24. This makes this expiration very important, quarterly options tend to be the most liquid.
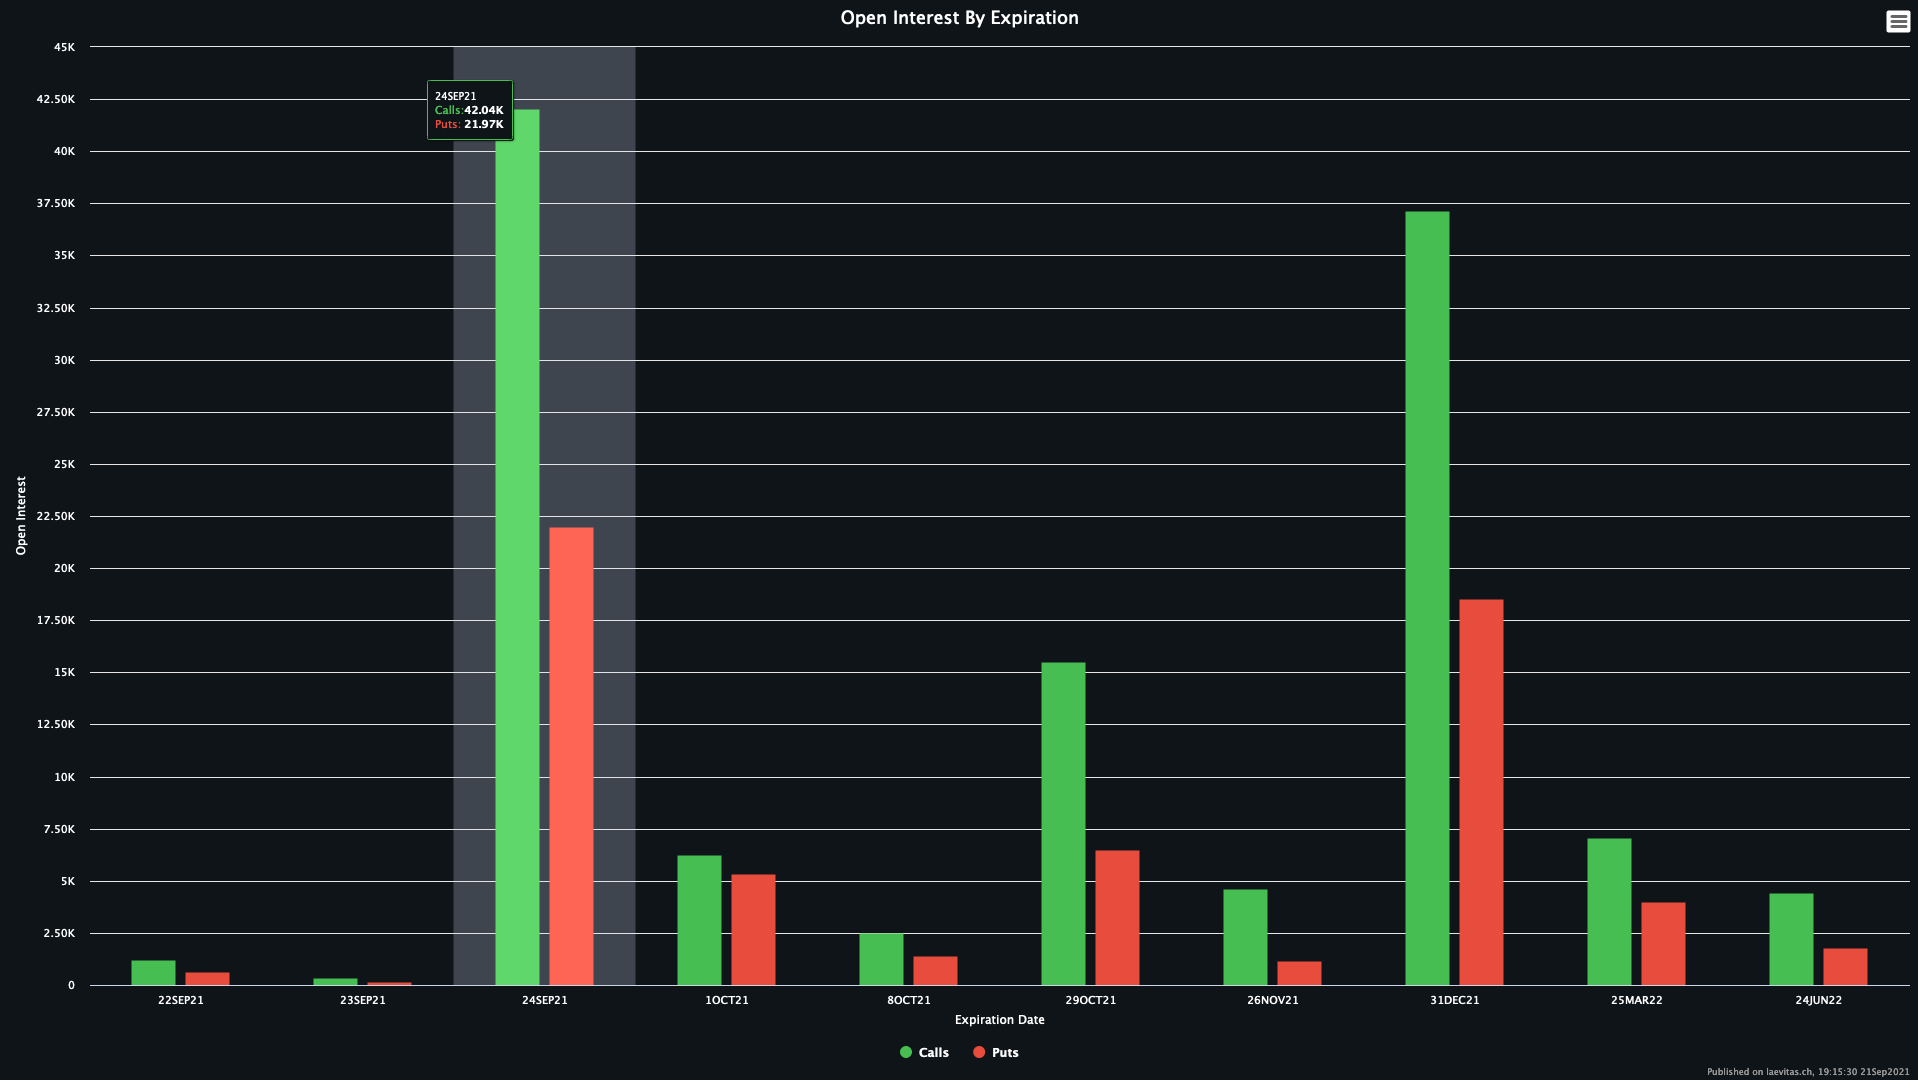
also there is a large position of options Call contracts above $50k, and this means that market makers will do everything they can to keep the price of bitcoin below $50k until the end of the day on Friday 24.
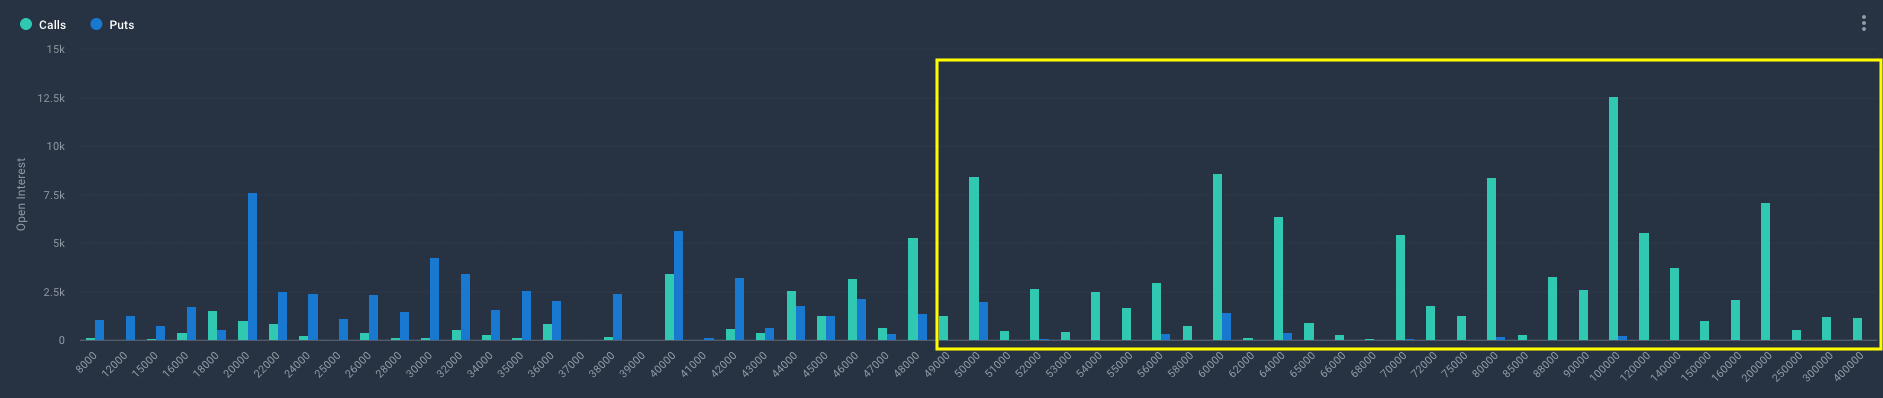
In the event that the Market Makers fail to keep the price below $50k and Bitcoin breaks this zone the MM's will be forced to hedge by buying Bitcoin in the Spot market, and this could catapult Bitcoin to the upside.
TA Key levels
Bitcoin has touched the first Naked POC, in case in here bitcoin breaks down the 40k$ zone it will surely touch the following Naked POC level that is around 37k$, this level is key because in case it was broken this could make the price slide up to 30k$.
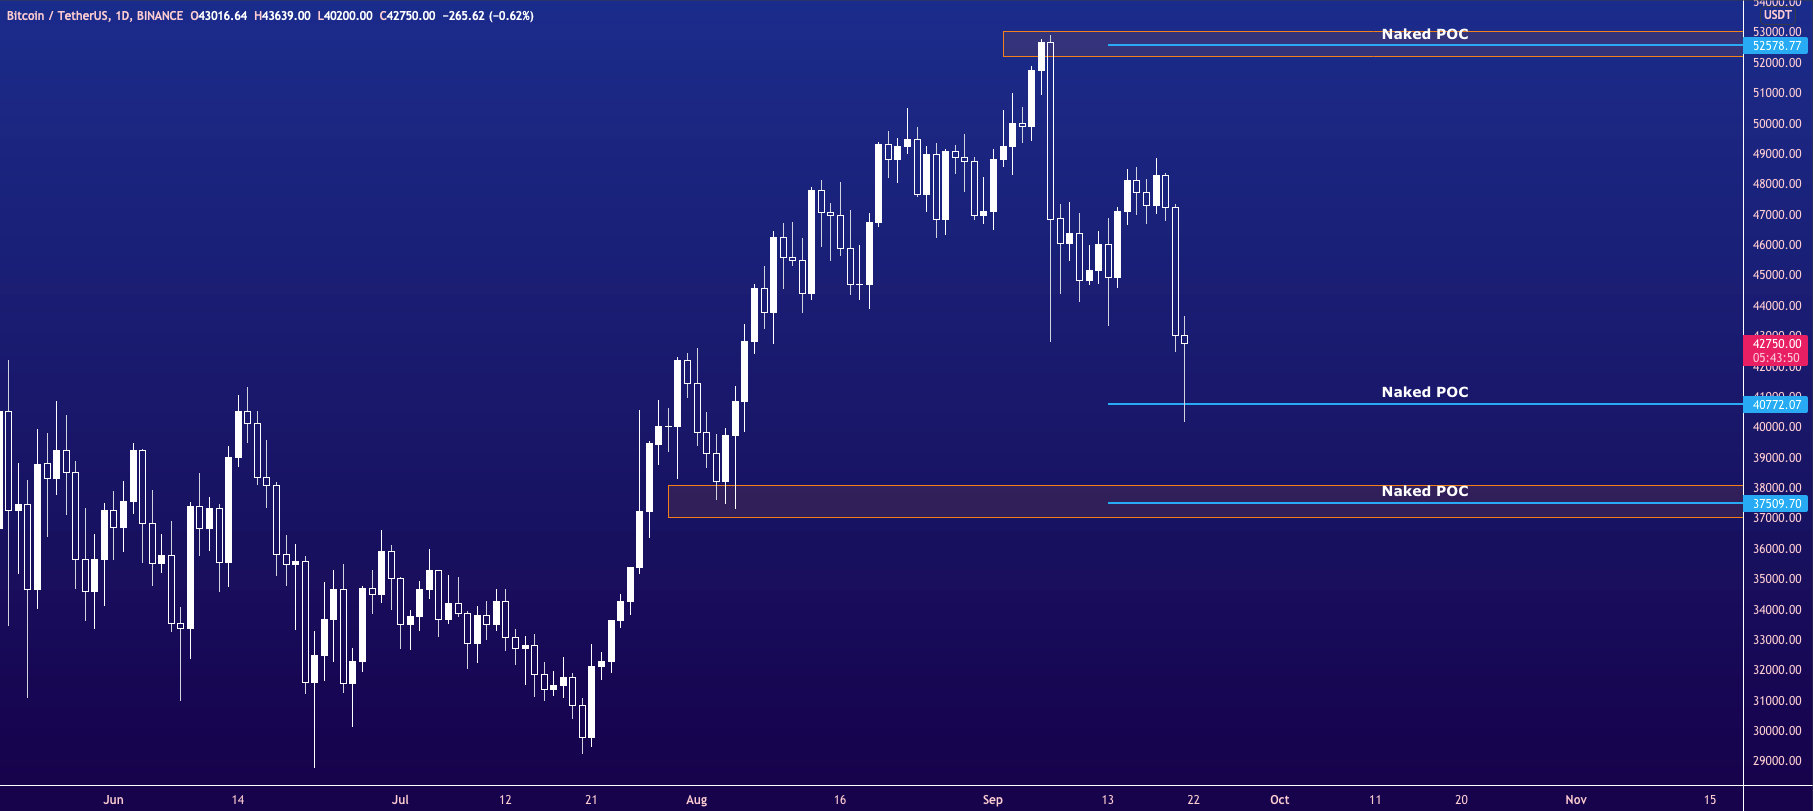
Regarding the upper key levels surely the 53k$ level is a key level because the overcoming of this area would indicate a continuation of bitcoin upward, all this always taking into account the previous analysis (on-chain and options).
Conclusions
Although On-chain and options data may hint at a more Bullish than Bearish macro position in reality the market is still very indecisive, and this week will be very turbulent for Bitcoin, in particular Friday 24 will be a very important day because with the expiration of Bitcoin options, with Marker Makers that will try to keep Bitcoin price under 50K$ until the expiration of that day and with traders that could push up instead, putting in difficulty the MMs that could cover themselves in the SPOT market, so it will be a battle between Bears and Bulls, that's why it's a week where I don't suggest to trade with high leverage because:
high volatility + undecided market = high probability to lose.
great analysis